When your facility had an illness cluster, how did you handle cleaning?
scenario- Hired a disinfection vendor0% (0)
- Had in-house staff do enhanced cleaning0% (0)
- Did both0% (0)
- Took no extra cleaning steps0% (0)
No votes yet — be the first
Real visitor votes, updated the moment someone answers. Never padded.
Live totals for every infectious disease disinfection poll on this site. A poll with only a few votes tells you very little, so treat these numbers as conversation starters and compare them with the sourced figures further down.
Send a short message to the follow-up inbox. A coordinator can reply by email. This form does not send emergency help; call 911 first if anyone is in danger.
No votes yet — be the first
No votes yet — be the first
No votes yet — be the first
No votes yet — be the first
No votes yet — be the first
No votes yet — be the first
No votes yet — be the first
No votes yet — be the first
No votes yet — be the first
No votes yet — be the first
No votes yet — be the first
No votes yet — be the first
No votes yet — be the first
No votes yet — be the first
No votes yet — be the first
No votes yet — be the first
No votes yet — be the first
No votes yet — be the first
No votes yet — be the first
No votes yet — be the first
No votes yet — be the first
No votes yet — be the first
No votes yet — be the first
No votes yet — be the first
Polls on this site measure what visitors say they believe or did. We do not check who they are or what kind of facility they run. A school nurse, a gym owner, and a cleaning supervisor may all vote on the same question from very different points of view. That makes polls good at showing common beliefs and where people disagree. But they are not reliable for anything like a rate or how often something happens. When a result looks surprising, think about who wanted to answer. Also ask if the wording of the options may have nudged people toward one choice.
The sourced figures in the statistics sections come from named public health agencies, standards groups, and research bodies. Each uses a method you can look up. They answer narrower questions with much more care. We cite them so you can read the original. On this site, those figures are kept apart from anything visitors vote on. Are you writing a memo for a board or a notice for families? Then use the sourced material. Treat poll results only as a hint of how others think. Label them clearly as opinion, not evidence.
Visitors to this page are not a random sample of everyone who deals with infectious disease disinfection. People arrive here because they are planning, worried or curious, so the mix of answers can lean toward whoever was searching that week. Watch the vote count under each poll before you draw a conclusion, and compare what people think with the sourced figures below.
CDC's 2019 Antibiotic Resistance Threats Report estimated 223,900 C. difficile cases in hospitalized patients and 12,800 deaths in 2017, with $1 billion in attributable healthcare costs.
Read with care: Counts hospitalized cases only; costs cover hospital-onset cases only.
Source: CDC (2019)United States, hospitalized patients, 2017 data
CDC estimated 323,700 MRSA cases in hospitalized patients and 10,600 deaths in 2017, with $1.7 billion in attributable healthcare costs.
Read with care: Excludes many uncultured skin infections; hospitalized cases only.
Source: CDC (2019)United States, hospitalized patients, 2017 data
CDC estimates seasonal flu caused 9.4 million to 51 million illnesses, 120,000 to 710,000 hospitalizations and 6,300 to 52,000 deaths annually in the U.S. between 2010 and 2025.
Read with care: Ranges reflect large season-to-season variation and are modeled estimates.
Source: CDC (2025)United States, annual range across 2010-2025 seasons
These figures are public research and agency data, not this network's own job records. Keep each number with its population, year and limits; none of them predicts cost, timing or outcome at a specific property.
Each visitor gets one vote per poll. Results show the share of votes for each option among everyone who has answered. Your browser remembers your choice. To limit repeat voting, the site uses a scrambled code that can't be traced back, not your name. Votes are not weighted by facility type or size. So results describe the people who chose to answer, not a true sample of all facilities.
Results update as new votes come in, so the percentages shift over time. This is most true on polls with fewer answers. The time of year can matter too. During a busy illness season, more people facing an active outbreak may vote. That can tilt answers toward urgent situations. Look at the overall patterns, not small changes between visits.
Not for that reason alone. A majority answer shows what voters say is common. It does not show what works or what fits your building. Whether fogging, targeted wiping, or both make sense depends on a few things. These include the germ, the product label and its contact time, and advice from your local health department. Treat the poll as a prompt for questions to ask your vendor. Then get the plan in writing.
Voting does not ask for your name, email, facility, or any contact details. Results appear only as totals for each option. Nobody viewing the results page can see how one person voted. The choice you made is remembered in your own browser, so the poll shows your answer when you come back. See the site's privacy policy for more on how visitor data is handled.
No. The polls record opinions and habits, not results. So they cannot show whether illness cases dropped. They cannot show whether a product was used as its label says, or whether a response met your state's rules. They also leave out details, such as which germ was involved or how large the building was. Use them to start a talk with staff or your vendor, not as proof that a method works.
The polls are built around real choices where careful people disagree. One example is whether to close a whole building or just the affected rooms. We write the options to be balanced, so results reflect real experience, not a leading question. When results are split, it often means the right answer depends on the setting and the germ.
Keeping each poll to one question makes voting quick. It also avoids collecting details that could identify a facility during a sensitive outbreak. The tradeoff is that results mix schools, clinics, gyms, offices, and homes together. When a result surprises you, think about how differently those settings work. Read the related articles for context before you draw conclusions.
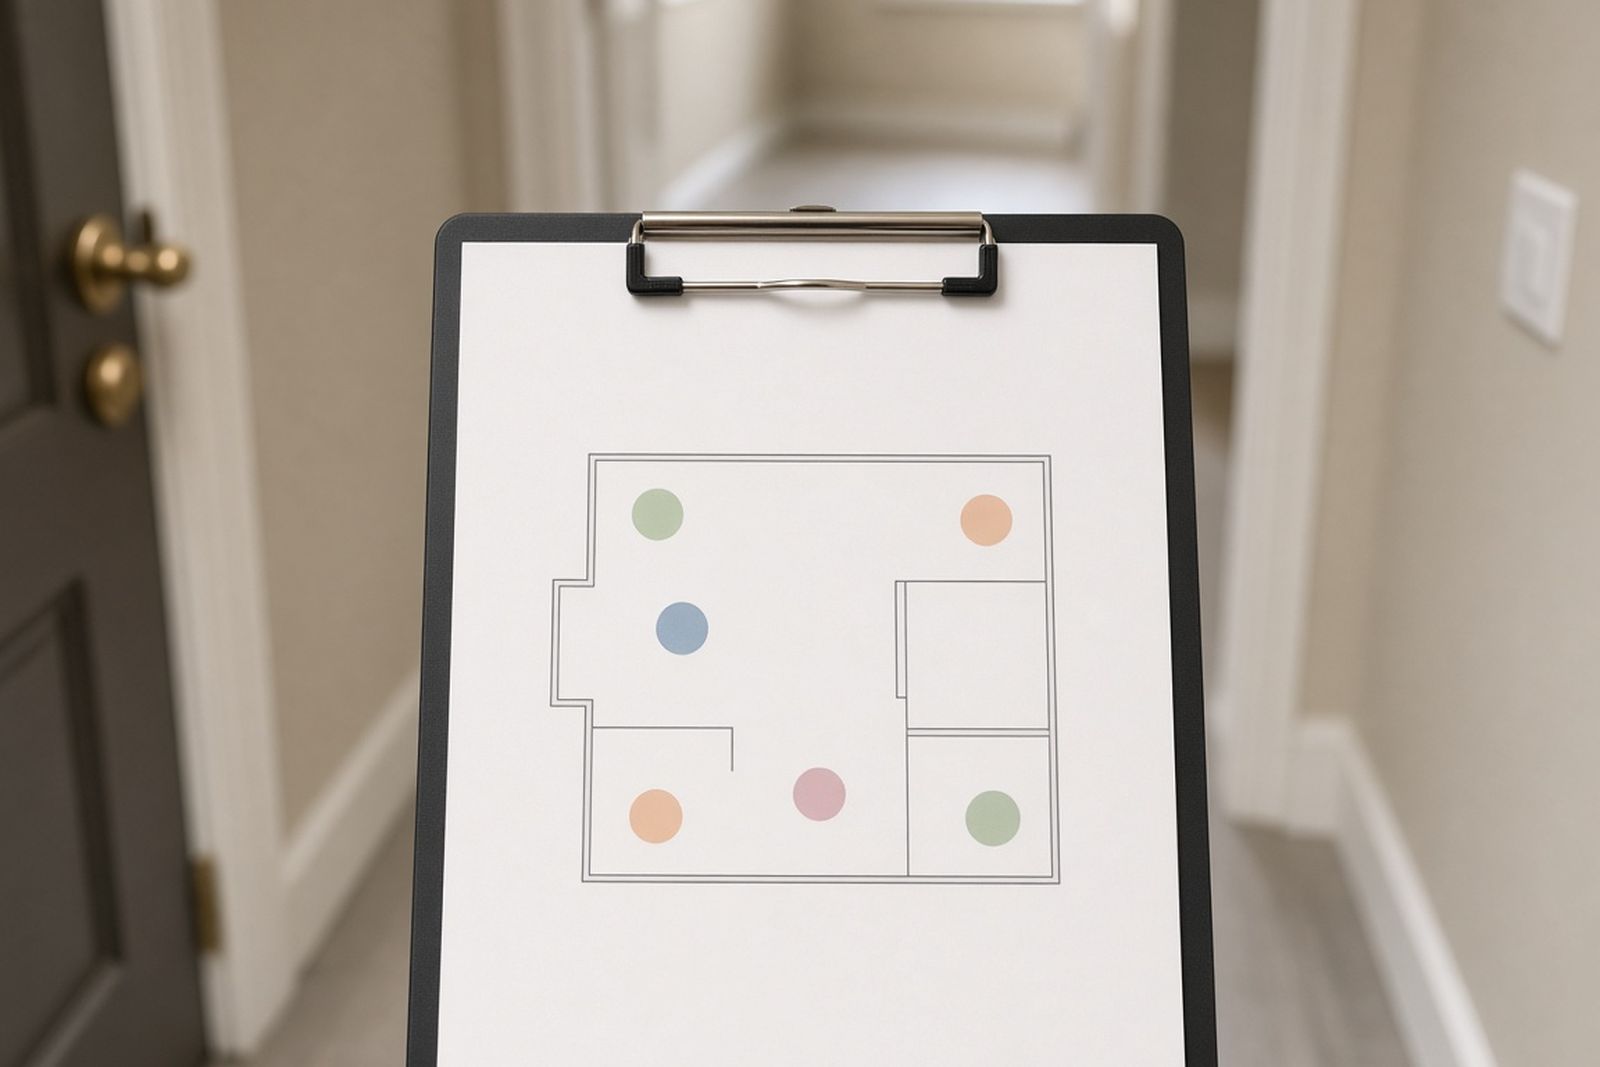
Learn how expert outbreak disinfection works in schools, offices, clinics, gyms, and care homes. See each step, from mapping high-touch spots to checking contact times and records.
What drives the price, published cost ranges, and how to read a written quote line by line.
Which policies may respond, how to document a claim, and what to do if coverage is denied.
Hands-on tools help you see cost drivers, check vendors, and organize a claim file. They also help you plan the first day, sort waste, and judge if staff can do the work.
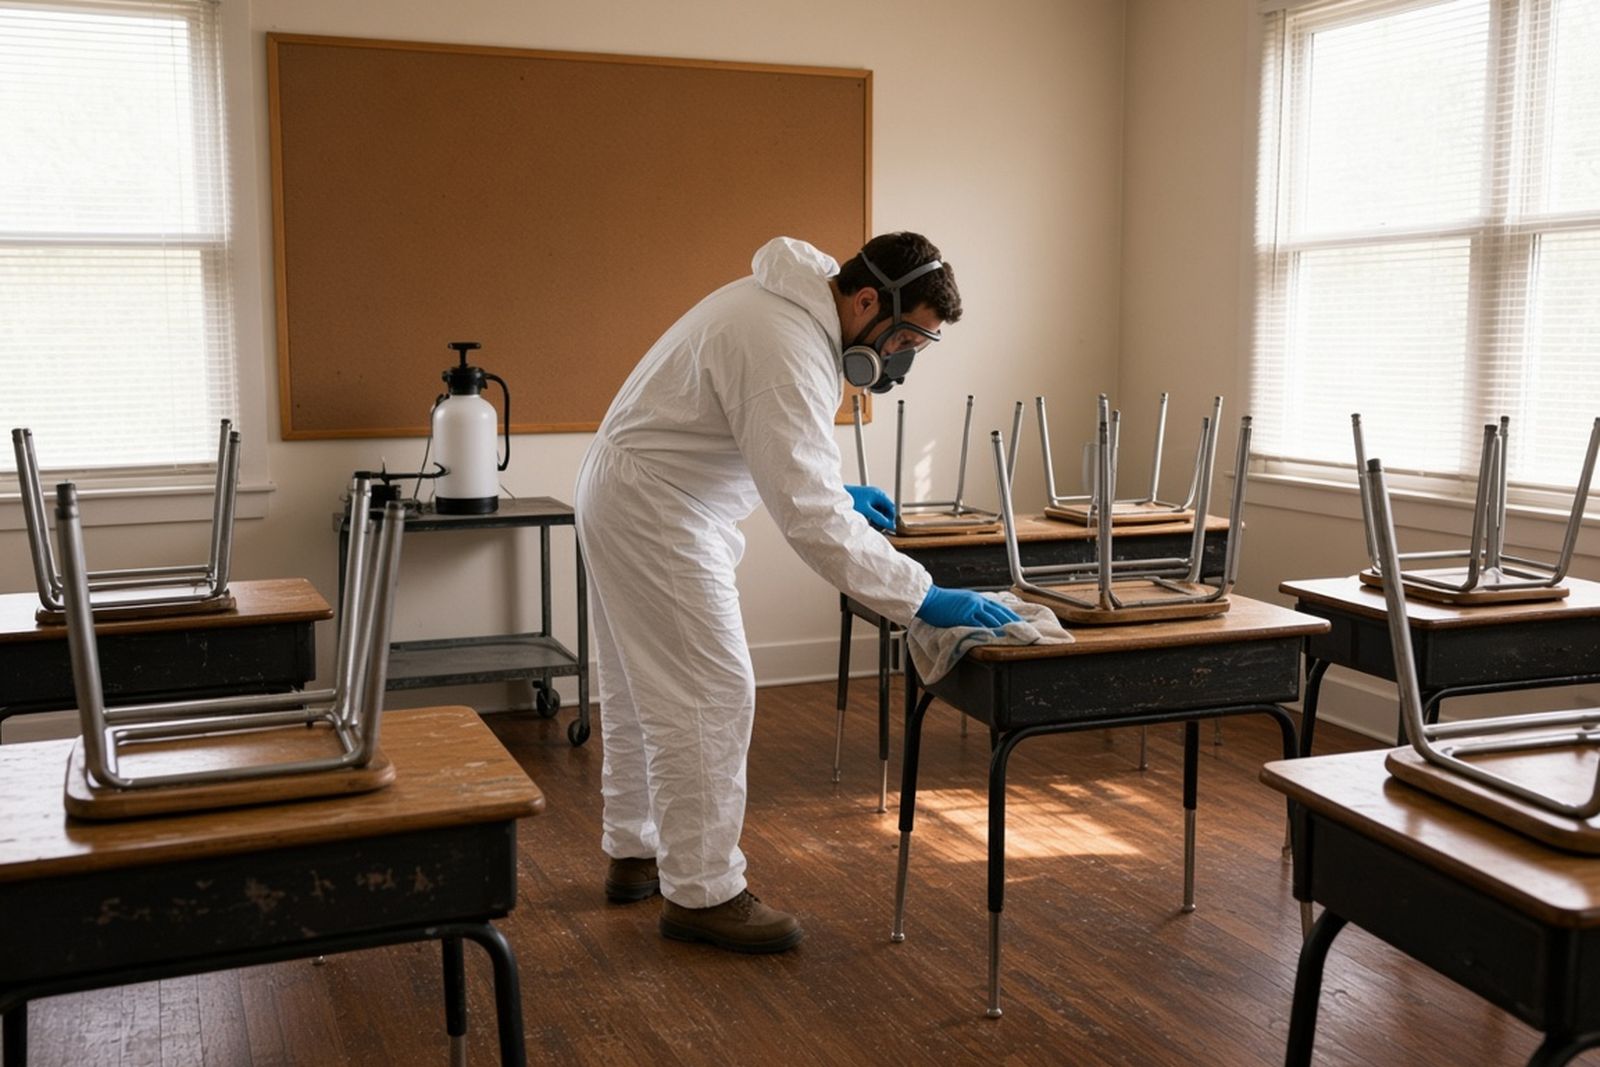
Test what you know about product labels, contact times, keeping germs contained, and records. Do it before you approve a disinfection plan or brief your leaders.
Articles on norovirus in schools, MRSA in gyms, EPA List N, contact times, and notes to parents. They are written for the people in charge of a building.
Find disinfection providers who serve your area for facility outbreaks. Learn what to confirm about products, training, and records before you hire.